PV America event (Courtesy of PV America)
Even before Japan’s nuclear nightmare began, the solar power market in the U.S. and abroad were set for another year of remarkable growth, according to several analysts and industry leaders.
One such individual suggested recently that the only close analogy to the coming surge in solar photovoltaic panels (PV) is Apple, Inc.’s performance last year after the iPad took off.
Excitement over solar’s continuing growth-spurt served as background music for a PV industry gathering that ended in Philadelphia last night.
“The solar industry is the fastest growing industry in America!” Rhone Resch, president and CEO of the Solar Energy Industries Association (SEIA), told some 3,000 conference-goers. “We are growing faster than wind energy, faster than telecommunications, and, thank goodness, we are even growing faster than the mortgage foreclosure industry!”
Bob Gibson, VP for market intelligence at the Solar Electric Power Association (SEPA), pointed to one large source of growth for the industry: utilities expanding their energy mix to include solar.
“In very real and growing ways,” said Gibson, “electric utilities … across the country are part of the renewable energy industry, and in particular, the business of building and providing solar power.”
The Numbers

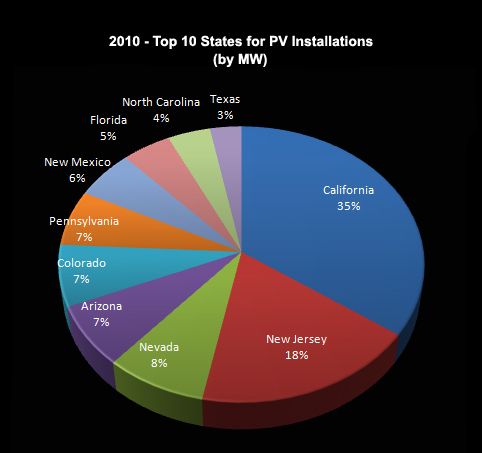
Figure 1. Top 10 States for PV installtions, 2010. (The Phoenix Sun)
And there are a lot of data to support such enthusiasm.
While the U.S. GDP grew just 2.8% in 2010, the domestic solar market jumped by 67% last year, according to GTM Research.
The GTM/SEIA U.S. Solar Market Insight, 2010 Year in Review holds a lot more good new for the solar sector. For example, grid-connected PV installations rose to 878 MW (megawatts) last year, a 102% increase over 2009.
While the pattern of growth was widespread, ten states account for over 60% of all new installations (see the breakdown in figure 1).
Notice that California grabbed the lion’s share, at 35% of the total. And that was before the state legislature passed a bill (on March 30) mandating that utilities obtain one-third of their electricity from renewable energy sources, including solar power, by the end of 2020.
(To be fair, former CA Governator, Arnold Schwarzenegger, had issued an executive order calling for the same goal, in 2009. That EO, however, could have been overturned by another governor and so didn’t provide the level of predictability utilities need to make significant investments in solar- a stability they now have.)

Other positive indicators cited in the GTM report:
- A marked increase in U.S. PV component manufacturing: 97% for wafers, 81% for silicon cells, and 62% for PV modules.
- The largest Concentrating Solar Power (CSP) plant built in two decades went online. (Martin Next Generation Solar Energy Center, 75-MW, in southeastern Florida.
- The installation of nearly 29,500 solar pool heating systems and 35,500 hot water systems.
You can read the entire article, complete with more images and at no charge, at Forbes.com.


