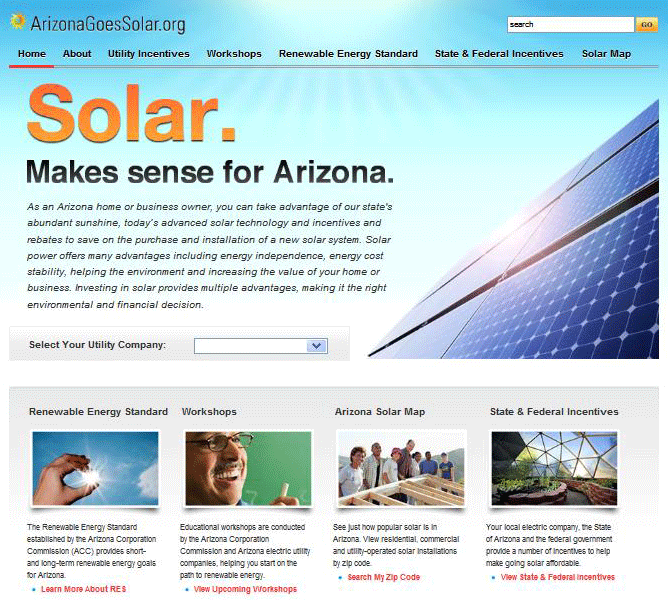
Arizona’s new solar website, mentioned here yesterday, is now live at www.arizonagoessolar.org.
“The site’s name says it all,” Arizona Corporation Commission chair Kris Mayes told reporters at a formal unveiling this morning. “It isn’t called ‘Arizona went solar.’ It isn’t ‘Arizona will go solar.’ It’s called ‘Arizona Goes Solar.’
“The Commission is hoping that Arizonagoessolar.org will be the meet-up place for every Arizonan who is interested in solar energy in our state,” explained Mayes. “This website will increase the transparency of solar rebates and incentives, and provide a real-time look at where solar systems are being deployed and how much energy they can produce.”
Briefly, here are a few screen grabs showing some of the new site’s features.
Arizona Solar Map
 For many, the most exciting and useful feature at the site is the mapping program. The site shows nearly every solar installation in the state by zip code. The information is supplied by the relevant utility company, and is updated every two weeks.
Say, for example, you’re considering installing solar panels at your home. Just plug in your zip code and see how many others have already gone solar.
Utility-scale solar projects are also mapped and can be located by zip code or simply by finding the blue utility icon on the map.
“The Arizona Goes Solar website will go a long way toward increasing transparency for solar installations,” said Commissioner Paul Newman. “We’ve heard a lot of complaints about the lack of information on solar reservations. This website will be a useful tool for solar installers, ratepayers, utilities and researchers.”
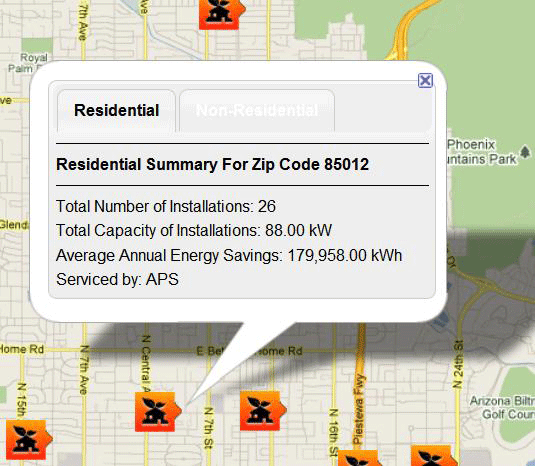
Details pop up when an icon is double-clicked. I plugged in my zip code and clicked on the icon to get the information seen in the graphic below. It shows a total of 26 residential installations in my area, with a total capacity of 88 kW.
You can also click on the “non-residential” tab to see details on commercial installations in your zip code. (There were none shown for mine, but that’s not too surprising. It’s a small residential neighborhood.)
There’s useful information about various aspects of solar power in Arizona throughout the site. For a first time user, it’s particularly helpful for understanding some of the more esoteric areas, such as the state’s Renewable Energy Standard:
The Arizona Corporation Commission (ACC) established the Renewable Energy Standard (RES) in August, 2007 to identify short– and long–term renewable energy requirements for the state. The long–term requirement is for 15 percent of retail energy sales from ACC–regulated electric utilities to come from renewable energy resources by the year 2025. The current RES requirement is 2.5 percent of total each utility’s retail sales in 2010 and the rules prescribe that 25 percent of that requirement is to come from distributed energy resources Distributed Energy resources are installed on the customer’s premises and are used to offset customer load, such as rooftop solar panels. Half of the distributed energy or customer–owned requirement must be met by systems among residential customers and the other half from business customers.
The site also includes information about various workshops held around the state…
…utilities…
…and links to tax credits, rebates and other incentives for renewable energy installations.
But there’s one thing you shouldn’t expect to find, Mayes told reporters at the unveiling: the names of politicians.
“This is the people’s page.” she said. “It’s designed solely to provide information on solar power. My hope,” concluded Mayes, who is term-limited out of the ACC this November, “is that it will remain just that.”
Filed under: All,Laws,Renewables,Solar,Southwest
Trackback Uri
